As part of the Harvey Mudd College Clinic Program, I worked on a project for the Kinohi Institute. Over the course of a year, we designed and built the first spatial heterodyne Raman spectrometer capable of operating at near-infrared excitation light. The team also tested and validated the performance of this device.
Raman spectroscopy is a common technique used to determine the material composition of a substance. Currently, the most common Raman spectrometers are slit spectrometers (which have low light throughput), and Fourier Transform spectrometers (which require sensitive moving parts). Spatial Heterodyne Spectrometry (SHS) has no moving parts and high light throughput, which means it is robust and non-destructive to the sample. The Spatial Heterodyne Infrared Spectroscopy (SHIRS) technique developed in this project can be employed to detect cancer, observe protein folding in real time, and could even be used for the non-destructive detection of extraterrestrial life.
In this post, I will describe how the device excites Raman signals, isolates the signal from noise, and identifies the Raman signal through spectroscopy. I will then discuss the results of the effort.
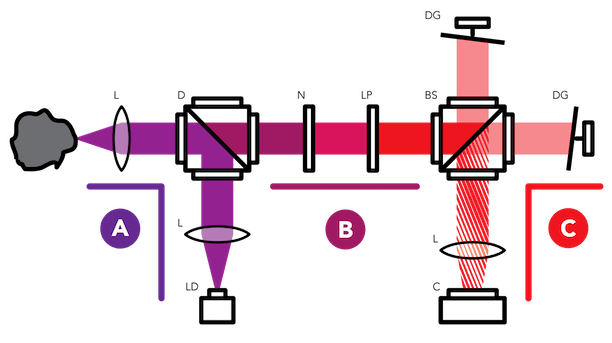
Exciting Raman Signals (A)

Raman signals are a form of light that reflects of molecules with a change in energy that acts as a signature for the molecule. Hence, if we shine light of a single, pure wavelength onto any molecule and identify the spectrum of the resulting Raman signals, we can correctly identify the molecule. However, this isn’t quite so easy. For one, Raman shifts are a very low probability event, which results in their signals being extremely weak. In addition, the unchanged reflection of the input laser (Rayleigh scattering) and fluorescent reflections are sources of noise that flood out the Raman signals. The method for dealing with this noise is discussed in the next section.
Isolating Raman Signals (B)
Aside from the advantages of causing little damage to organic samples, using a near infrared excitation laser has the additional advantage of causing much less fluorescence than the more conventionally used visible or UV excitation lasers in Raman or SHS systems. Additionally, since Raman shifts are known to be longer wavelength than the excitation laser, a Long-Pass Filter (LP on Figure 1) and Long-Pass Dichroic Mirror (D) are used to ensure that all light of lower than the excitation wavelength are heavily attenuated. A Notch Filter (N) is used to heavily attenuate the Rayleigh scattering from the excitation laser. The remaining light is mostly composed of just the Raman signal at a sufficiently high Signal-to-Noise ratio. The next section will discuss how a Spatial Heterodyne Spectrometer recovers the spectra of this light.
Identifying Raman Signals (C)
With reference to Figure 1, the SHS works by first using a 50:50 Beam Splitter (BS) to direct the light towards two Diffraction Gratings (DG). The light then reflects of these gratings at a wavelength-dependent angle. Since the angle of reflection depends on wavelength, there is a wavelength-dependent separation between the the two reflected wavefronts that recombine on the Camera’s Sensor (C). From the theory of interference, we know that the frequency of oscillations in an interference pattern depends on the angle separating the wavefronts. Thus, the wavelength of light is encoded in the frequency of oscillations produced on the camera’s sensor. Performing a Fourier Transform on the resulting image recovers the spectrum of the input light.

The figure above shows examples of fringe patterns created by single-frequency sources (top), and the spectra that are generated from the fringe patterns (bottom). The generated spectra are compared to spectra gathered from an off-the-shelf spectrometer. We can see that for two test cases, the device functions as an accurate and precise spectrometer compared to an off-the-shelf alternative.
Results
The complete SHIRS system was validated as a standalone spectrometer on various test sources such as Hydrogen, Neon, and Sodium Vapor Lamps. The spectrometer demonstrated a bandwidth of 131 nm and a resolution of 0.1-0.6 nm, which satisfy the constraints for the desired applications of the Kinohi Institute.

The figure above shows the spectrum of the sodium vapor lamp captured by the team’s SHS and the ScienceSurplus slit-based spectrometer. Notice that only the team’s SHS is able to resolve sodium’s characteristic double peak.
The complete system was validated by testing elemental Sulfur, which is known to have a strong Raman signal and is a typical first-test case.

This figure shows the Raman spectrum gathered using the team’s prototype from a sulfur sample. The peak seen matches the peak expected from published Raman spectra to within 1 cm-1. This spectrum was reproducible across multiple trials.
I completed this project on a team with Alex Alves, Achintaya Bansal, Erica Martelly, and Apoorva Sharma. The team was advised by Professors Philip Cha and Gregory Lyzenga of Harvey Mudd College. If you would like to apply this technology to any of your work please contact me or the liaison of this project from the Kinohi Institute, Dr. Michael Storrie-Lombardi (mike@kinohi.org).
