Blog

Causation and Correlation

If you’ve ever taken a statistics course, you’ve probably heard an instructor warn that “correlation does not imply causation”. After hearing it, I definitely knew to be wary of making such associations, but never had a good answer to the question: “If there are no causal relationships at play, why am I seeing correlations?”

In this post, I’m going to talk about three ways in which you could find correlations between two variables even though there’s in fact no causal relation between them. Though my examples are completely made up, I’ll illustrate the following:

  1. Why countries introduced to social media might see rises in extremism,
  2. Why we might find that people who are vaccinated are more likely to be diagnosed with autism, and,
  3. Why an amateur dietician might come to the conclusion that weight gain is an appropriate remedy for bad skin.

First, let’s define correlation and causation a bit better.

Let’s start with correlation. If I randomly picked a person from the population, and found out that they had a college degree, I’d find that they were more likely than the average person to own a Tesla. This means that a person’s having a college degree is correlated with them owning a Tesla, i.e. knowing if they have a college degree changes the likelihood that they also own a Tesla.

Now does this mean that having a college degree causes them to own a Tesla? Perhaps, but not necessarily.  If I randomly picked a person from the population, and put them through college to the point where they got a college degree, and then found that they became more likely to own a Tesla, this would be an instance of causation. More precisely, if having some property A (like a college degree), causes you to have some property B (like owning a Tesla), then forcing someone to have A will make them more likely to have B. 

From now on, I’m going to refer to these properties (e.g. having a college degree, owning a Tesla, etc.) as variables, because they can take on one of many values (e.g. True or False). When talking about causal relationships between variables, it’s convenient to use a Causal Diagram.

generic.png

In the diagram above, we’ve represented a situation in which A causes B. If there were no arrow, we would represent a situation in which A does not cause B, i.e., even if we had forced A to be true, it would have no influence on whether B were true.

I’m now going to describe three ways in which, despite there being no causal relationship between two variables, we still observe correlations between them. Before we jump in, let me remind you again that all these examples are completely made up for the sake of illustration.

The Mediator

I’m going to start off with the most intuitive but least surprising way in which two variables could be correlated despite having no direct causal relationship between them. Let’s say that we’re looking into whether we can blame social media for a rise in extremism. Consider the Causal Diagram below:

mediator

Here, we’re assuming that social media doesn’t directly cause a rise in extremism in a country, but rather causes the country to have a platform for Fake News, and that this platform in turn causes a rise in extremism. Let’s put some numbers on things. Let’s say 60% of all countries have widespread use of social media. Since certain social media companies don’t do a great job of filtering out Fake News, let’s say:

  1. If social media has widespread use in a country, there’s a 95% chance it has a platform for Fake News, and,
  2. If social media doesn’t have widespread use in a country, there’s a 30% chance it has a platform for Fake News (perhaps a messaging app or some other medium).

Furthermore, let’s say:

  1. If a country has a platform for Fake News, there’s a 70% chance it experiences a rise in extremism, and,
  2. If a country doesn’t have a platform for Fake News, there’s a 20% it experiences a rise in extremism.

Lets look at an imaginary world of 400 countries at a glance:
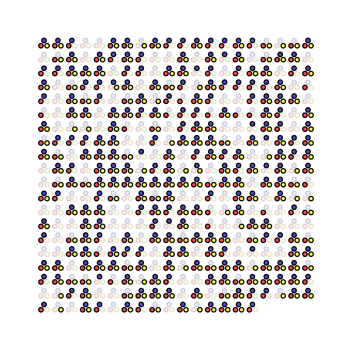
Mediator_spNone.png

In the picture above, each triplet of dots is a country. If the dot is shaded dark, then that variable is true for that country. For example, if a red circle is shaded dark, then that country has a platform for Fake News.

What we’re interested in seeing is whether countries with widespread use of social media (blue dots) are more likely to see a rise in extremism (yellow dots). We study this by splitting the population by whether they have widespread use of social media:
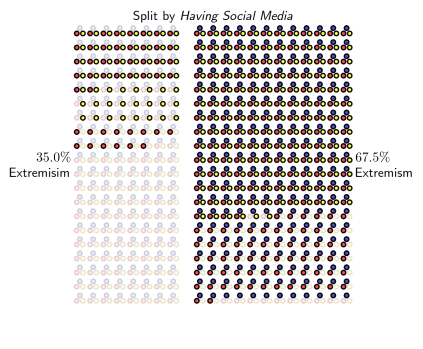
Mediator_spB

In the left column, we’ve grouped countries that don’t have widespread use of social media, and in the right column, we’ve grouped countries that do. It’s easy to see from this grouping the effect we suspected, only 35% of countries without social media have seen a rise in extremism, while 67.5% of countries with social media have seen it.

This clearly suggests that if a country wanted to curb the rise in extremism, they should ban social media, right? Well, sort of. What they would be missing is that widespread use of social media caused a rise in extremism only because it created a platform for Fake News. You can see this more clearly in the picture below, where we first split the population by whether or not they have a platform for Fake News, and then see if countries with social media have any influence on the rise in extremism for each group separately:

Mediator_spAspB.png

What we see is that the effect almost completely disappears, and any residual effect is only due to the fact that I’m using a population of only 400 countries as opposed to larger number.

So would you have been wrong in saying social media causes a rise in extremism? No, because in this case, social media is an indirect cause. But understanding the mediator leads to the insight that if you want to control the rise in extremism, you’re better off preventing social media platforms from becoming platforms for Fake News, than banning them altogether.

So what’s the takeaway? If you’re pretty confident that one variable causes another, consider whether that causation acts through a mediator. Controlling the mediator would be a more effective way of controlling the variable downstream.

The Confounder

In the case of the mediator, you’d still be right in technically saying that A caused C, even if it caused it indirectly. We’re now going to look at the most common source of spurious correlation, the confounder, a.k.a. the ‘common cause’. Here, you would not be correct in assuming the correlation you’re observing indicates causation.

We’re going to see why we might find that people who are vaccinated are more likely to be diagnosed with autism, despite there being no actual causal relationship between them. Let’s say we have population of a million people. Of these million people, 30% of them happen to be children. Since its more common for a person to get vaccines around when they’re children, lets say that:

  1. If you’re a child, there is a 70% chance you got vaccinated in the last 6 months.
  2. If you aren’t a child, there is a 10% chance you got vaccinated in the last 6 months.

Now, since its more common for someone to be diagnosed with autism when they’re a child rather than when they aren’t, lets say that:

  1. If you’re a child, there is a 15% chance that you get diagnosed with autism.
  2. If you aren’t a child, there is a 2% chance that you get diagnosed with autism.

confounder

The causal diagram above reflects these relationships, but notice that it doesn’t explicitly reflect any causal relationship between being recently vaccinated and having autism. Nevertheless, if one were to just look at these two variables, you’d find that people who had just been vaccinated were almost four times more likely to be diagnosed with autism that those who hadn’t!

Heres why. The picture below on the left represents the population, where each triplet of dots is a person. As before, if the dot is shaded dark, then that variable is true for that person.
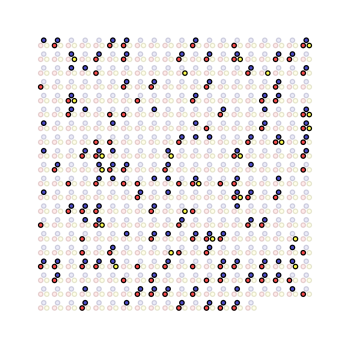
Confounder_spNone.png

Let’s rearrange the population a bit in the picture below, separating people who haven’t been vaccinated (on the left) and those who have (on the right).

Confounder_spB

The astute anti-vaxxer might look at the number of people diagnosed with autism in each group. On the left, you’d see that only 3.5% of people are diagnosed with autism, while on the right, 12.5% of people are. This might lead a person to the conclusion that getting a vaccine makes you almost four times as likely to be diagnosed with autism! Note that this is despite the fact that in the Causal Diagram I used to generate this population, there is no actual causal relationship between vaccines and autism.

So what would an epidemiologist do in this situation? Assuming they suspected that being a child is a confounding variable, i.e. a likely cause of both getting vaccinated and being diagnosed with autism, they would control for whether the person is a child. In the picture below, we see how this is done.

Confounder_spAspB.png

We first split our population based on whether the person is a child (on the right) or not (on the left). Then, we ask separately for each population: does having been vaccinated make you more likely to have autism? Looking at the numbers, you’d see that people are no longer four times more likely to be diagnosed with autism if they’d been recently vaccinated. As it turns out, the only reason you see any difference at all is because I’m representing a million people with 400 people.

So what’s the takeaway? If you see a statistic saying “people who do A are X times more likely to have condition B”, think about whether there might be a common cause responsible for that correlation.

The Collider

Next up, what I think is the most interesting but least obvious source of spurious correlation: the collider. Let’s imagine an amateur dietician who has seen about 200 clients. In the population, let’s say:

  1. 40% of people are overweight, and,
  2. Independently, 40% of people have acne.

Now let’s assume that both being overweight and having acne might be reasons a person would see a dietician. Specifically, let’s say:

  1. If a person is not overweight and doesn’t have acne, there’s a 10% chance they’d see the dietician,
  2. If a person is either overweight or has acne, but not both, there’s a 60% chance they’d see the dietician, and,
  3. If a person is both overweight and has acne, there’s a 70% chance they’d see the dietician.

collider.png

Now lets say we look at the population as a whole, as in the picture below:

Collider_spNone

And now, as before, we check if being overweight makes you any more or less likely to have acne by splitting the population into those who are overweight, and those who aren’t:

Collider_spB.png

As expected, we see that being overweight has no effect on having acne, i.e. a person’s chances of having acne are the same (40%) whether or not they are overweight.

But, let’s now imagine that the dietician made the mistake of assuming that their clients were representative of the population, i.e., they assume that trends they observe amongst their clients are trends present in the population. The figure below illustrates this. The right column is the subset of the population that has visited the dietician. On the top of the column, we have the people that are overweight, and at the bottom are the people that aren’t.

Collider_spAspB.png

What would be apparent to the dietician is that, of their clients, those who are overweight are only half as likely to have acne. This might make them want to draw the conclusion that weight gain is a good remedy for acne. As we saw in the earlier figure, this conclusion would be wrong! In the population as a whole, having acne and being overweight were independent.

Is this something only a dietician should worry about? Well, it comes up more often than you might think. Imagine that you leave a sheltered childhood to join a big university. You might notice people who are intelligent are less likely to be athletic. Though, since being intelligent and being athletic are both sufficient causes for getting into the university, you might be incorrect in generalizing this observation to the population at large.

So what’s the takeaway? If you’re making observations about a subset of people, be careful about whether the variables you’re observing caused them to be in subset. Scientists studying psychedelics in the 60’s had a particularly hard time with this because the people who signed up to participate in their studies did so because they were inclined to try psychedelics and, and so were not very representative of the population at large.

Summary

I showed three ways in which you could observe a correlation between two variables (say, A and B) even though one didn’t directly cause the other. In the case of the mediator and confounder, we saw that there might be a third variable you’re missing, and had you controlled for that variable C, the correlation you see between A and B would disappear. However, in the case of a collider, controlling for that third variable C is the source of the correlation, so you want to make sure you’re not controlling for it. We saw that people tend to introduce correlations through colliders by unintentionally assuming a subset of the population is representative of the whole, thereby unintentionally controlling for a variable.

The next time you come across a statistical correlation used to argue for some causal relationship or another, I hope you use these lenses to consider ways in which that correlation might be spurious, and what else you might need to know to see if it is.

References

Want to know more about probabilistic modeling and causality? Check out the resources below:

  • The Book of Why: The New Science of Cause and Effect by Judea Pearl (2018), which is a great popsci read and what inspired me to write this post,

  • Chapter 2 of Decision Making Under Uncertainty by Mykel J. Kochenderfer (2015), which is a fantastic textbook written by my PhD advisor at Stanford, and,
  • This Coursera course on Probabilistic Graphical Models, if you want to know how to use this stuff at scale.
 

A Brave New World

Imagine you are given the funds to support five underprivileged 18-year old students through college. You hold a call for applicants, and receive one hundred applications. In addition to asking for quantitative metrics such as grades and extracurricular achievements, you also interview each student. On what basis would you allocate the funds?

Presumably, you would try to elicit an estimate of how likely the student was to succeed in college if given the scholarship. For simplicity, let’s call this the student’s aptitude. A sensible allocation of the scholarships would be to the students who you estimate have developed the highest aptitude. 

Now consider an alternative allocation strategy—a lottery that randomly picks five students from a hat and gives them the scholarships. Again, for simplicity, let’s assume that all one hundred applicants came from similar socioeconomic backgrounds. The second strategy would disregard merit in favor of assuring equality of opportunity.

Personally, I would lean toward favoring the first strategy. Given that all applicants are from similar backgrounds, a demonstration of aptitude likely correlates with the applicant having put in hard work, and is the best predictor I have that they will maximize their use of the opportunity.

If your intuitions agree with mine, let’s make this more interesting. Suppose you are given scholarships to support a 5-year old through a superior education and upbringing. Again, you get a hundred applications, again of students from similar underprivileged backgrounds. Would you try to assess these five year olds’ aptitudes, and give the scholarship to the one with the highest aptitude?

If you’re like me, you certainly didn’t display your aptitude for anything you thrive at today when you were five. So, it would seem that assigning based on the aptitude of a five year old is not a good, or fair strategy, because of how poorly aptitude at that age predicts aptitude in the future. However, if you had access to an oracle that could perfectly estimate how likely the five year old was to succeed at the superior school, then perhaps you would want to give the scholarship to the one with the highest chance of succeeding. If this intuition doesn’t sit right with you, it’s worth thinking about what you think changes between when the child is five and eighteen, aside from them simply fulfilling the oracle’s prophecy. 

This oracle doesn’t exist, but what factors might it have considered? Our aptitude at the age of 18 is presumably a function of three things—nature (i.e. one’s genetic predispositions), nurture (i.e. environmental factors such as whether one endured an abusive home, or whether their drinking water was contaminated with lead), and depending on your philosophical inclinations, possibly free will. 

I was surprised to learn in this podcast with Robert Plomin, that through genome wide associated studies, an individual’s genes can be surprisingly good at predicting their aptitude for certain skills. Let’s call a person’s genetic predisposition to succeed at a given task their genetic aptitude. As the science progresses, we will find that for many skills, genetic aptitude will be poor predictors of overall aptitude, and in others, they might be highly predictive.

Consider, hypothetically, that the ability to play the violin at a professional level is almost entirely governed by genetic aptitude. Let’s say you’re given a scholarship to provide a single, underprivileged baby the finest possible violinist education, but you’ve received 100 applications. Suppose they were also screened for genetic aptitude, and we find that only one of them has a noteworthy genetic aptitude. What this means is if we were to give the scholarship to all but one of them, we would be nurturing little more than a nice hobby in them, but if we give it to the one with noteworthy aptitude, we might set them up for a thriving career in violin. Would you give it to the baby with the highest genetic aptitude?

If you’re inclined to say yes, the implication is pretty dire—we are tacitly saying that allocating resources based on ones predetermined aptitudes would create a better society than one in which these aptitudes were ignored. 

Suppose in addition to an applicant’s genetic aptitude, we also received an evaluation of their environmental aptitude, i.e. their upbringing, neighborhood, family, and probably friends, were all considered to estimate how likely it is that they could be nurtured to succeed in a particular field. Imagine, hypothetically, that the ability to play guitar is governed little by genetic aptitude but almost entirely by environmental aptitude. Again, suppose we have 100 babies’ applications, and only one has noteworthy environmental aptitude for playing guitar. Would we give a guitar scholarship to her, or give it to one at random?

If we’re being consistent, we should probably give it to the one with the highest environmental aptitude. This, for me at least, sounds a moral alarm bell—something seems unfair here. Those babies didn’t choose their environments, so why should one be privileged with a scholarship after already winning a lottery in terms of the environment they’re born into? Household income is probably a very relevant environmental factor, and so we would end up giving scholarships primarily to the rich! Presumably, a fair society would do all that is possible to counteract the influence of environment on aptitude, it would try to ensure every baby an equal opportunity to succeed at a particular task. 

But is an assignment on genetic aptitude any less fair than one on environmental aptitude? The genes a baby is born with is just as much a luck of the draw as their environment. If a fair society tries to counteract the effects of environment on aptitude, and the technology were available, then it would try to also counteract the effects of genes, right?

So now we have a society in which all babies are equally likely to succeed at any particular task. But, since the process merely spread out likelihood over all babies as opposed to concentrating them in a few, we end up having no one particularly likely to be exceptional at anything. 

It’s possible that this homogenous society is able to sustain itself, but would one that deliberately fostered exceptional individuals be better off? Would a society with exceptional scientists be more likely to find the cures for their cancers than one without. 

So, would you choose a society in which aptitudes were equalized, or one where we deliberately distribute aptitudes so that we have 5% of babies with a very high aptitude for thriving as doctors, another 5% as artists, and so on? Note that in such a society, since aptitudes are predetermined, we would have no reason to monetarily compensate those who are exceptional doctors and more than those who are exceptional janitors. Everyone would be playing their part, and would earn the same standard of living for doing so.

The world we’ve ended up with is essentially the world described by Aldous Huxley in the book Brave New World. When one reads it, it appears to be a dystopia, but in this blogpost I’ve tried to illustrate that we might want such a world if we buy into one pretty benign premise: that if given a 100 applications for college scholarships from underprivileged individuals, we would give the scholarships to those with the highest aptitudes, and not assign them at random.

In this post, I’ve made a couple of grave oversimplifications. Firstly, I’ve tacitly assumed that we are doing the most good for society by rewarding success, instead of passion for passion’s sake. The second is that I’ve implicitly assumed that it is even possible perfectly predict what an individual could bring to a given field based on their genes and environment. This firstly ignores the implicit value of their lived experience, and assumed an omniscient level of knowledge about the possible futures an individual could encounter in their lives. 

These simplifications aside, I do believe there is a question worth considering here. Supposing we have two individuals, Alice and Bob, living in similar environmental conditions, and we genome sequence them. We find Alice’s genes make her 10% more likely to not only be better at violin than guitar, but also to enjoy it more. Say the opposite is true for Bob—he is 10% more likely to enjoy guitar and to be good at it. Would we use this information, and encourage them toward the two instruments asymmetrically? Or are we better off ignoring this information? 

Optimal Blackjack Strategy Using MDP Solvers

A Markov Decision Process (MDP) is a powerful way to allow AI to make decisions in uncertain environments. In this project, I used the algorithm to provide the optimal strategy for Blackjack. I then compared the strategy to a widely available “Blackjack Cheat Sheet”, and found the strategy provided by MDP and the cheat sheet to have comparable performances of expecting to lose only 5¢ on a $10 bet, which is around the “house advantage” of 0.5% to the casino, indicating that it is indeed an optimal policy.

MDPs and Blackjack Rules

Traditional MDPs are most applicable to situations where the decision space is finite and discrete, the outcomes are uncertain, and the terminal state and its rewards are well defined. Furthermore, the situation must be made to abide by the Markov assumption, that the next state is a stochastic function of only the current state and the action applied.

Blackjack is played against a dealer, where the player is dealt two cards and the dealer exposes one card. The player aims to get the total face value of his or her set of cards as close to 21 without going over. Using the knowledge of their own cards and the single exposed dealer card, they must choose to either Hit (where they are dealt an additional card), Stay (where they attempt to beat the dealer with the cards they currently have), Double Down (where they hit and double their current bet), or Split (where if they currently hold two cards that are a pair, they split the pair into two hands, add the same bet to the additional hand, and hit on both). If the player hits in any form and busts (by going over 21), they lose. Else, if they stay, the dealer exposes another card, and must hit as long as their total value is less than 17, and stay otherwise. If the dealer busts or stays with a value lower than the player’s, the dealer loses. Else if their value is the same, they push (no reward), and otherwise, the player loses. The last relevant rule is that if the player or dealer hold an A, the value held by the A is a ‘soft’ 11, meaning it holds a value of 11 so long as doing so doesn’t make the hand’s total value exceed 21. Otherwise, the A takes a value of 1.

Blackjack meets the characteristics for applying an MDP because the players state can be defined by the total value of the hand they hold, whether or not it is a pair, and whether or not the hand is ‘soft’ (with an A acting as an 11). The dealer’s state is defined entirely by the value of the single card displayed, and thus the entire game’s finite state space is defined by the player’s state and the dealer’s state. Furthermore, the next state of the game is stochastically defined completely by the current state and the player’s action (Hit (H), Stay (S), Double Down (DS), or Split (SP)).

Solving an MDP gives us an optimal (reward maximizing) action (H, S, DD, SP) for a every possible state. For an MDP that has n possible states and k possible actions, the problem is defined by a State Transition Matrix (P) of size n \times n \times k, which specifies the probability of transitioning from state s to s‘ via action a. The problem is fully defined by providing a Reward Matrix (R) also of size n \times n \times k, which specifies the reward gained by transitioning from state s to s‘ by action a. Once the matrices P and R are provided, an MDP solver can be used to provide a decision policy \pi of size n, where the decision policies (\pi_i) are members of the action space and specify the action to be taken in a given state i.

Framing Blackjack as an MDP

Thus in order to get the optimal strategy for Blackjack, we must first enumerate and encode the possible states of the game, and then compute P and R. A few assumptions must be made about the game to form an efficient encoding:

  1. Infinite decks: if we assume that cards are being drawn from an infinite set of decks (typically at least four), then no advantage is gained from keeping track of the specific cards open, but mostly just their face value, dramatically reducing the number of required states.
  2. Constant Marginal Utility of Money: If we assume that the player is indifferent between doubling from $10 to $20 and doubling from $20 to $40, then we only need to keep track of whether the player has ever doubled down, and not the number of times they did. The reason for this is that with the assumption, we only care about whether we should double down from a game state that we haven’t doubled down yet. If we want to know whether we should do so from the new state, we can use the decision policy of the equivalent state assuming we hadn’t doubled down yet. Thus we can use a simplifying rule that is a player can only double down one time.
  3. Using the first two assumptions, we can also see that if we split, the strategy used given either hand is not affected by the state of the other, and so we only need to keep track of one of the hands in our state.

Using these assumptions, we observe that the available states for the players hand are a Hard (no A acting as an 11) 5-21, Soft 13-20 (21 ignored because we know the strategy will be the same as if it were hard), Pair of 2-10 and A, giving us 35 possibilities. Note that all face cards are assumed to be 10. Additionally, the dealer’s hand could have an exposed 2-10 or an A, a total of 10 possibilities. Additionally, we keep track of whether or not we have doubled down as a binary state. The total number of combined states is 35*10*2 or 700 unique states. Lastly, we append on four terminal states (Bust, Lose, Push, or Win), giving us a total of 704 states.

With the states enumerated, the next step is to compute the transition probabilities from one state to the others given an action. Let us examine the Hit action for a Hard 5. This state can transition to a Hard 7-14 if any of the cards 2-9 are dealt, and thus transitions to these with a 1/13 probability. It can additionally transition to a Hard 15 with any of 10-K, so has a 4/13 probability. Finally, if an A is dealt with a 1/13 probability, it will transition to a Soft 16. If the action were a double down, the transition probabilities would be the same, but the transitions would be to the set of states assigned for having doubled down. As another example, if we hit on a pair of A’s, and a 7 is dealt with 1/13 probability, we transition to a Soft 18.

Carefully considering all possibilities, we can fill out the transition probabilities for the Hit, Double Down and Split actions. A quick bug-check is to ensure that the rows of P sum to 1, ensuring that a state must always transition to at least one of the other states.

Lastly, we must fill out P for the Stay action. If we stay with a value of 17, and the dealer has an exposed 9, we know that there is a 4/13 probability they will show 10-K and have to stay at 19. However, if they show any card from 2-7 with 1/13, then they must hit once more, leading to a lot of individudal cases to consider. A simpler way to find the transition probability from, say, my having a 18 and the dealer showing a 4, is to perform a Monte Carlo simulation and approximate the probability. Simulating the game an excessive 10,000 times for each of the 350 unique gamestates (double down states act identically), we estimate the transition probabilities from a given state to possible terminal states under the Stay action. We also handle illegal actions (like splitting without a pair) by sending them straight to Bust.

The next step is to fill out the reward matrix R. As a reminder, we need to state the explicit reward for transitioning from a given state s to another state s’ under some action a (even if the transition would be impossible). There are only a few cases to be handled:

  1. If we bust by hitting from any normal state, we lose a nominal amount like $10.
  2. If we bust by hitting having previously doubled down, or doubling down, we lose double the nominal, so $20.
  3. If we lose by staying on a normal or doubled down state, we lose $10 or $20 respectively.
  4. If we win by staying on a normal or doubled down state, we win $10 or $20 respectively.
  5. If we make any other legal move, we get no explicit reward.

Having specified P and R, we now simply use an MDP solver to get the decision policy. For this project, the open source MDP toolbox for MATLAB was used (link). The mdp_LP function asks for P, R, and a discount rate (set at 0.999 because we don’t care if we make extra moves to win), and returns the optimal policy, which is a vector of actions for each state.

Evaluating the Policy

The optimal policy returned by using an MDP is shown below, and compared to a “Blackjack Cheat Sheet”.

Blackjack

We can see a surprising amount of similarity for the Hard player hands, but some discrepancy for the Pairs and Soft hands. Though this discrepancy exists, the results still seem to line up reasonably with intuition. In fact, the cheat sheet seems to have some inconsistencies between Pair and Hard hand strategies – it recommends hitting regardless of the dealer on a Pair 6, but recommends staying for moderate dealer hands on a Hard 12, which is an identical hand under a Hit. These inconsistencies don’t seem as frequent in the MDP output.

To test the performance of these decision policies more rigorously, I performed a Monte Carlo simulation of 1,000,000 games for each policy, using this Blackjack simulator on MATLAB. The policies were also compared to a very naive policy of Staying no matter what your state. Using a $10 nominal bet per game, it was found that the MDP policy and the cheat sheet have expected losses of 6¢ and 4¢ respectively, but with standard deviations in these estimates (of expected loss) of 1.2¢. Using MATLAB’s ttest2 (two-tailed t-test) to test for a statistically significant difference in performance, we can assert that the cheat sheet is better with about 90% confidence.

On the other hand, the naive strategy has an expected loss of a much larger $1.6, with a standard deviation of 1¢ on that estimate. Using ttest2, we can assert that the MDP strategy is better with near perfect confidence.

While the difference between the MDP performance and that of the cheat sheet is very marginal, the likeliest for why is performs worse is that I made a small error in painstakingly filling out the almost two million state transitions probabilities in P. However, what is clearly evident is that the exercise does generate a near optimal strategy for playing Blackjack, one that performs much better than a naive decision policy.

Conclusion

The purpose of this project was to get familiar with using Markov Decision Processes to provide optimal strategies in discrete, finite state stochastic environments. Blackjack seemed to be a perfect candidate to try the algorithm on. To formulate the game in a manner acceptable to an MDP solver, I first specified the probabilities for transitioning from each gamestate to every other under all actions using either explicit analysis or Monte Carlo simulation. I then specified the rewards for transitioning from game states to terminal states under the different actions. With these matrices specified, I used the MDP solver to provide the optimal strategy. I compared this strategy to a widely available “Blackjack Cheat Sheet”, which claims to be the optimal blackjack strategy. Repeatedly simulating the strategies in the game of Blackjack, I found that both the MDP’s strategy and that of the cheat sheet lose only about 5¢ per $10 bet on average, while a more naive strategy loses $1.6 on the same bet. According to wizardofodds.com, the “house advantage” for a game of Blackjack with the assumed rules is around 0.5%. The house advantage indicates the expected value of the dealer assuming the player is playing optimally, and thus provides evidence that the strategy given by the MDP is indeed close to optimal.

I did this project with the help of Dilip Ravindran, a close friend and graduate student at Columbia Economics.

Spatial Heterodyne Infrared Raman Spectrometry

As part of the Harvey Mudd College Clinic Program, I worked on a project for the Kinohi Institute. Over the course of a year, we designed and built the first spatial heterodyne Raman spectrometer capable of operating at near-infrared excitation light. The team also tested and validated the performance of this device.

Raman spectroscopy is a common technique used to determine the material composition of a substance. Currently, the most common Raman spectrometers are slit spectrometers (which have low light throughput), and Fourier Transform spectrometers (which require sensitive moving parts). Spatial Heterodyne Spectrometry (SHS) has no moving parts and high light throughput, which means it is robust and non-destructive to the sample. The Spatial Heterodyne Infrared Spectroscopy (SHIRS) technique developed in this project can be employed to detect cancer, observe protein folding in real time, and could even be used for the non-destructive detection of extraterrestrial life.

In this post, I will describe how the device excites Raman signals, isolates the signal from noise, and identifies the Raman signal through spectroscopy. I will then discuss the results of the effort.

Complete System
Figure 1: The complete SHIRS system. The Raman signals are excited in section A, filtered from noise in section B, and the resulting signal is transformed into a spectrogram by the Spatial Heterodyne Spectrometer in section C. 

Exciting Raman Signals (A)

ExcitingRamanSpectra

Raman signals are a form of light that reflects of molecules with a change in energy that acts as a signature for the molecule. Hence, if we shine light of a single, pure wavelength onto any molecule and identify the spectrum of the resulting Raman signals, we can correctly identify the molecule. However, this isn’t quite so easy. For one, Raman shifts are a very low probability event, which results in their signals being extremely weak. In addition, the unchanged reflection of the input laser (Rayleigh scattering) and fluorescent reflections are sources of noise that flood out the Raman signals. The method for dealing with this noise is discussed in the next section.

Isolating Raman Signals (B)

Aside from the advantages of causing little damage to organic samples, using a near infrared excitation laser has the additional advantage of causing much less fluorescence than the more conventionally used visible or UV excitation lasers in Raman or SHS systems. Additionally, since Raman shifts are known to be longer wavelength than the excitation laser, a Long-Pass Filter (LP on Figure 1) and Long-Pass Dichroic Mirror (D) are used to ensure that all light of lower than the excitation wavelength are heavily attenuated. A Notch Filter (N) is used to heavily attenuate the Rayleigh scattering from the excitation laser. The remaining light is mostly composed of just the Raman signal at a sufficiently high Signal-to-Noise ratio. The next section will discuss how a Spatial Heterodyne Spectrometer recovers the spectra of this light.

Identifying Raman Signals (C)

With reference to Figure 1, the SHS works by first using a 50:50 Beam Splitter (BS) to direct the light towards two Diffraction Gratings (DG). The light then reflects of these gratings at a wavelength-dependent angle. Since the angle of reflection depends on wavelength, there is a wavelength-dependent separation between the the two reflected wavefronts that recombine on the Camera’s Sensor (C). From the theory of interference, we know that the frequency of oscillations in an interference pattern depends on the angle separating the wavefronts. Thus, the wavelength of light is encoded in the frequency of oscillations produced on the camera’s sensor. Performing a Fourier Transform on the resulting image recovers the spectrum of the input light.

SHSresults

The figure above shows examples of fringe patterns created by single-frequency sources (top), and the spectra that are generated from the fringe patterns (bottom). The generated spectra are compared to spectra gathered from an off-the-shelf spectrometer. We can see that for two test cases, the device functions as an accurate and precise spectrometer compared to an off-the-shelf alternative.

Results

The complete SHIRS system was validated as a standalone spectrometer on various test sources such as Hydrogen, Neon, and Sodium Vapor Lamps. The spectrometer demonstrated a bandwidth of 131 nm and a resolution of 0.1-0.6 nm, which satisfy the constraints for the desired applications of the Kinohi Institute.

Sodium

The figure above shows the spectrum of the sodium vapor lamp captured by the team’s SHS and the ScienceSurplus slit-based spectrometer. Notice that only the team’s SHS is able to resolve sodium’s characteristic double peak.

The complete system was validated by testing elemental Sulfur, which is known to have a strong Raman signal and is a typical first-test case.

Sulfur

This figure shows the Raman spectrum gathered using the team’s prototype from a sulfur sample. The peak seen matches the peak expected from published Raman spectra to within 1 cm-1. This spectrum was reproducible across multiple trials.

I completed this project on a team with Alex Alves, Achintaya Bansal, Erica Martelly, and Apoorva Sharma. The team was advised by Professors Philip Cha and Gregory Lyzenga of Harvey Mudd College. If you would like to apply this technology to any of your work please contact me or the liaison of this project from the Kinohi Institute, Dr. Michael Storrie-Lombardi (mike@kinohi.org).

Magnetic Levitation with an FPGA

IMG_3362
Figure 1: The physical system components

In this project, a small disc magnet is levitated by a solenoid that is PID controlled by an FPGA at 156 kHz sample rate. A slower open loop is driven by a Raspberry Pi to stably move the magnet between set points. The Pi communicates the set point, steady state voltage, and gains, thus slowly making big transitions by commanding smaller jumps with accurate linearization. A video of the system in action can be found here.


blockdiagram
Figure 2: Block diagram of system components


Figure 2 shows a block diagram of the system components. As shown in Figure 1, the physical system is composed of a solenoid above a disc magnet. A PID controller is implemented on an FPGA to control the position of the disc magnet. The 10-bit position of the magnet is measured by the Hall-effect sensor, which is located about an inch below the solenoid so it avoids saturation from the solenoid’s magnetic field but still detects the disc-magnet’s field. The voltage from the sensor is passed through an ADC and then through a pre-calibrated lookup-table to estimate the position of the magnet. The position is then compared to the desired setpoint and used to compute a voltage across the solenoid. The voltage is computed by a PID controller that implements discrete-time derivative filtering for improved performance. This voltage is then passed through a PWM to generate a binary control signal. This control signal leaves the FPGA and is applied to a transistor which controls the current flow to the solenoid.

The linearized gains and feed-forward voltages most applicable to a given setpoint were found in calibration and stored on a Raspberry Pi. The Raspberry Pi takes a desired setpoint and passes the associated gains and feed-forward voltage to the FPGA’s PID module over SPI. In order to create the up-and-down motion seen in the video, the Pi takes small, discrete steps to march the magnet to the endpoints, holding each command for a time long enough for the magnet to reach the desired intermediate location and dissipate its transient response.

The project was done as a joint final project for the Harvey Mudd College courses Microprocessor Design (E155) and Systems Simulation (E205). The project was done in collaboration with Vaibhav Viswanathan.